Quantifying the middle of nowhere
24 December 2024
Learning about geospatial data
I talk about Tamworth more often than I’d like to. Most recently I was discussing its whereabouts in the UK and I ended my description with “basically the middle of nowhere” which led me to wonder if I can measure how remote Tamworth is and if there is a place that is the most “middle of nowhere”.
A Geographic Information System or GIS is software that handles geospatial data which is a term used to describe data that has components that deal with some location on the earth.
Geographical data typically come in two different forms: vector data and raster data.
Vector data describes geospatial data using three geometric primitives: points, lines and polygons. Raster data on the other hand represents information using a grid of square cells where each cell is given a value.
Today I will be using vector data from the Office for National Statistics and analysing it in Python using geopandas.
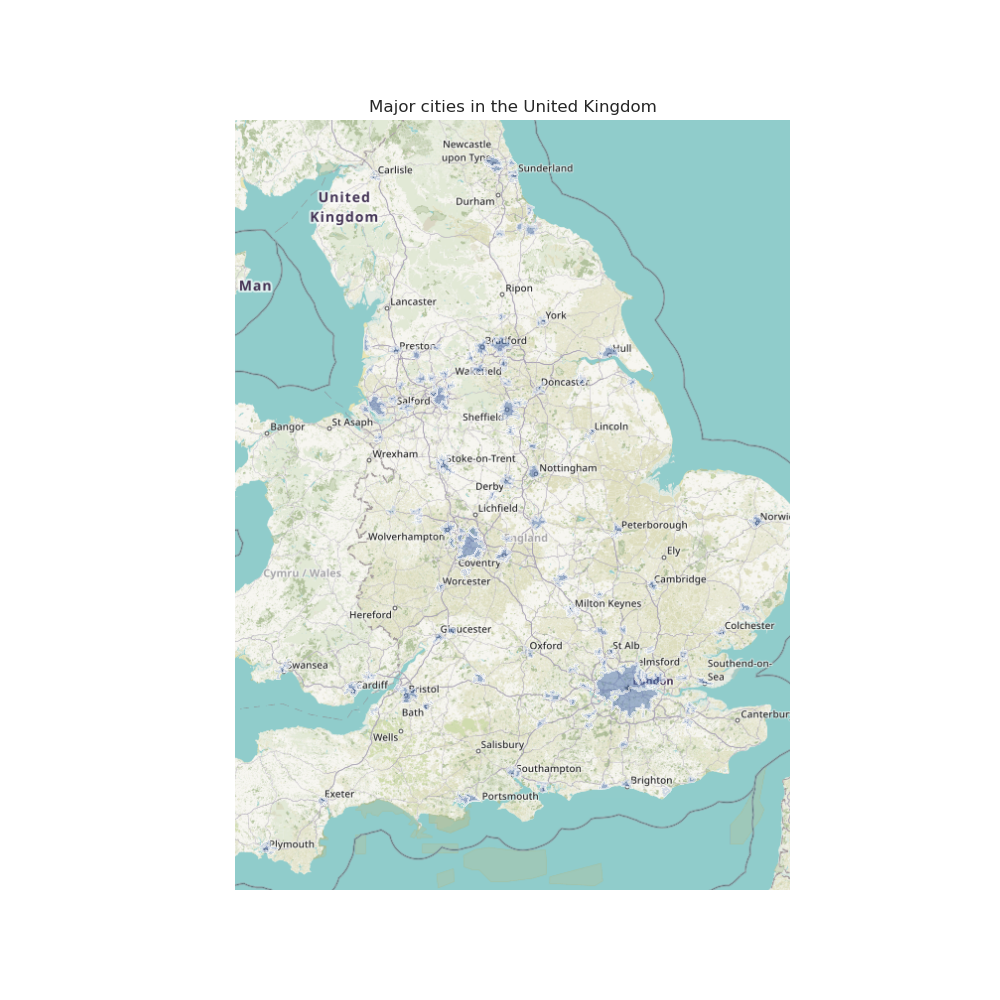
I first looked at the Major Towns and Cities dataset to get a feel for doing basic operations in geopandas. The ONS also released an accompanying web visualisation for the dataset if you want to check it out.
We use latitude and longitude to represent locations on our round earth however when working with data we often project it onto a 2-dimensional grid and the way we do this is defined by the Coordinate Reference System or CRS which are identified by their EPSG code.
Datasets from the ONS use the British National Grid system which has an EPSG of 27700. This is important as I want to overlay my data onto a map of the United Kingdom which I get from OpenStreetMap which uses the Web Mercator Projection so after importing my data I need to convert the data so that it uses the same coordinate system.
Plotting the data looks like this on the map

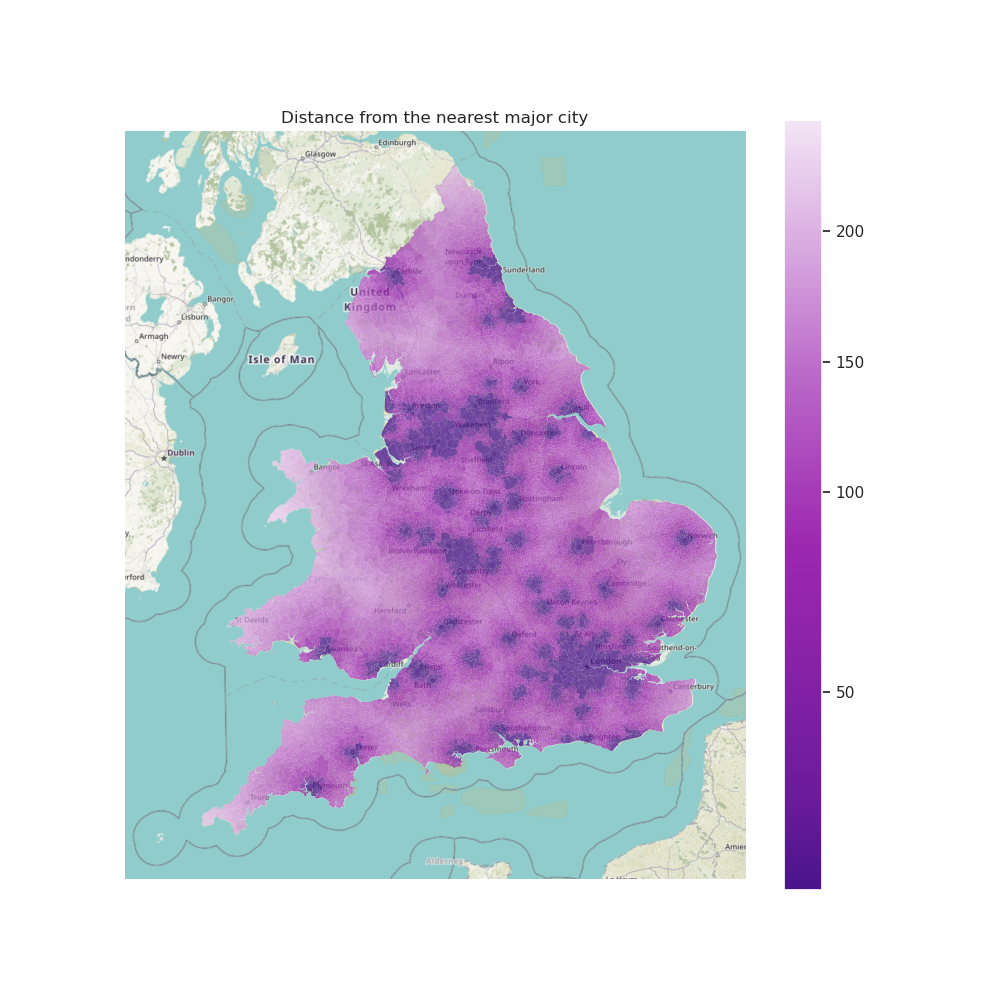
I now iterate through locations in the UK and score them based on their distance to the closest major city I use the Parish dataset from the ONS which contains vector data for parish boundaries in England and Wales.
After processing the data and performing the Box-Cox power transform for my remoteness metric I get the following graph where lighter colours indicate a more remote area

Ranking Local Authority Districts by their remoteness I get the following rankings for the most remote places in England and Wales.
| Rank | Local Authority |
|---|---|
| 1 | Isles of Scilly |
| 2 | Isles of Anglesey |
| 3 | Gwynedd |
| 4 | Ceredigion |
| 5 | Pembrokeshire |
This seems pretty fair and I think I’ve successfully defended Tamworth.
References
[1]: Practical Geography for Statistics, Office for National Statistics
Data Sources
[2]: Major Towns and Cities, Office for National Statistics
[3]: Parishes and Non Civil Parished Areas, Office for National Statistics
[4]: Local Authority Districts, Office for National Statistics